The pulsed DC excitation field was a slow rise, steep fall 66 kHz waveform. The current sensor impedance was selected as 100kohm. The electrode utilized as the electric field radiation platform was one of the plates from a Raytheon JAN5R4WGB full wave high voltage rectifier tube. The surface area of one side of this plate was approximately 2.25 sq. inches.
The battery bank voltage was then increased in steps allowing sufficient time for the voltage across the input R-C filter to stabilize. At each step, the AC plate current, input voltage, peak-to-peak current fluctuation and peak-to-peak voltage fluctuation were measured. In figure 4 the peak-to-peak current fluctuations are plotted against increasing input oscillator voltage. Figure 4 is a graph showing these results.
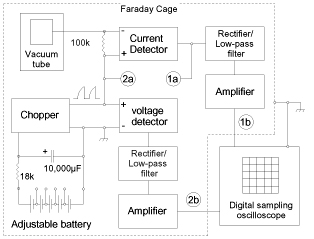
In
figure 5 the current waveform for the tube electrode at the maximum
test voltage is shown. This measurement is taken at point (1a) from
figure 2 without any amplification. The positive portion of the
waveform shows the portion of the cycle when the electrons are being
drawn out of the plate to create a positively charged electric field in
the vacuum. The negative spike occurs when the chopper connects the
plate to ground and the electrons rush back to the plate and neutralize
the field. Since the current detector has a 20x attenuator at the
input, the corresponding current scale is 200 uA per division.
Similarly figure 6 shows the input oscillator voltage. The voltage was measured at point (2a) from figure 2 without amplification.
Figure 7 is an oscillograph of a 50 second plot of the vacuum current fluctuations. This measurement is taken at points (1b) for the current (upper trace) and (2b) for the voltage (lower trace). As it can be clearly seen, the current fluctuations do not follow the voltage fluctuations. The current and voltage are both attenuated by 20x by the detector circuit and then amplified by 1000x. The overall amplification is then 50x. The observed current fluctuation is 296mV / 50 = 5.92mV. 5.92mV / 100kohm = 59.2nA. The peak positive portion of the current waveform in figure 5 is 290uA. This is a fluctuation of 0.0204%. For comparison, the voltage fluctuation is 0.0256%.
Plates with large surface areas allow for the formation of much stronger electric fields at the same voltage as compared to the relatively small vacuum plate. For comparison, figure 8 shows the current waveform for a 300 sq in. insulated plate in air. This current is measured at point (1a) before rectification, filtering and amplification. The vertical scale is 400uA per division and the peak positive portion is 1.03mA.
Similarly the voltage waveform and ultra-low frequency (ulf) fluctuations are shown in figures 9 and 10 respectively. In figure 10, the current fluctuations (upper trace) have a scale of 40nA per division. The peak-to-peak current fluctuation was 81.6nA or 0.0079%. The voltage fluctuation was 0.0081%.
Demonstration of the vacuum fluctuation using the Heliognosis Model LM2
A commercial version of the above circuit, the Heliognosis Experimental Life Energy Meter LM2, was connected in the Faraday cage and operated from a 12V gel cell battery. The meter was allowed to warm up for 30 minutes before measurements were taken to insure stability. To rule out the effects of temperature, all the readings were taken over a period of 30 minutes and the temperature was monitored with a mercury thermometer. The temperature at the beginning of the experiment was 17.4 C. At the end of the experiment, the temperature was 17.1 C. The LM2 has a much stronger damping filter than the laboratory version used above to allow observation of the fluctuations outside of a Faraday cage. The stronger filtration reduces the observed fluctuations somewhat but also filters 60Hz more effectively. A smaller flat plate was first tested (40sq in) with the amplification set to x1000 and the rear switch in the large plate position (200kohm sensor impedance). A large plate, model LM03-AC, with a surface area of 300 sq in was next connected with the same operating conditions. The zero controls were adjusted for each plate to keep the average reading on the analog meter around 10%. The chart recorder output was connected to the TDS320 DSO and provided oscillographs of the vlf and ulf fluctuations.Figure 11 shows an example of the large plate AC fluctuations over a period of 0.25 seconds. As can be seen, the vlf current fluctuation is quasi-cyclic with several frequencies such as 11.5Hz, 25Hz and 40Hz. Electromagnetic interference such as 60Hz is effectively blocked by the Faraday cage and is not visible in the waveform.Peak-to-peak fluctuations:
AC (vlf only) DC (vlf + ulf) small plate 7.9nA 11.2nA large plate 12.3nA 21.4nA
Figure
12 shows an example of the DC fluctuations for the large plate over a
100 second interval. The combined vlf and ulf fluctuation corresponds
to a peak to peak value of 21.4nA.
Conclusions
From the above results it is apparent that the electric field around a vacuum plate fluctuates dynamically with a quasi-cyclic oscillation in the vlf and ulf range. The AC current to the vacuum plate varies by as much as 0.0204% within the input voltage and current range studied. The vacuum fluctuations were found to increase proportionately to the input plate voltage. It was also found that increasing plate area also increases the fluctuations. The effective conclusion is that the electric permitivity is not constant but rather a function of the local zero point energy vacuum fluctuations.